

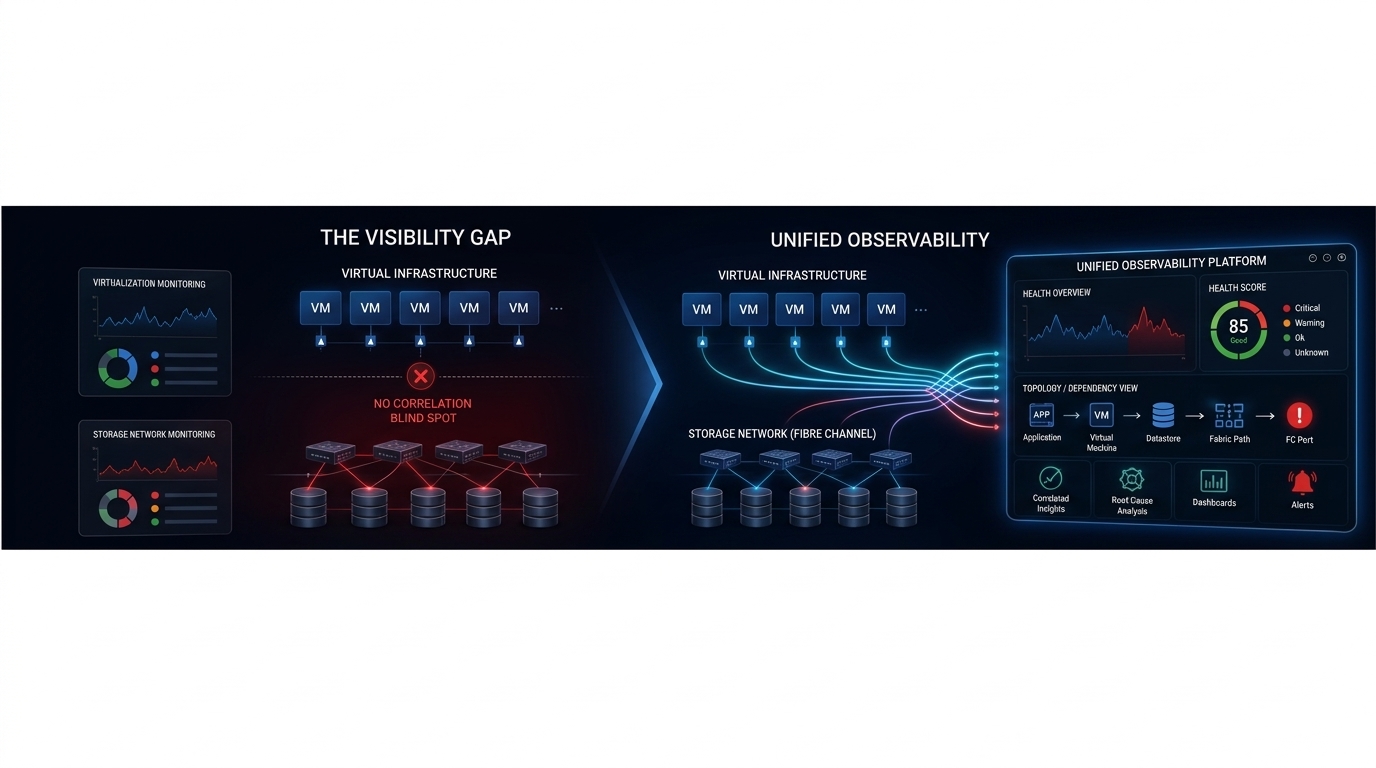
In a large data center, the virtual machines that run the business and the storage network that feeds them are tightly coupled. A virtual machine reads and writes through a storage fabric, and when that fabric is congested, the application on top of it slows down. Yet these layers are often operated by different teams using tools built around different data models. When something goes wrong, that separation becomes an operational blind spot.
The virtualization team may see the symptom—a sluggish workload—without seeing the condition one layer down in the storage network. I have spent much of my career on both sides of this divide, building platforms that monitor large storage fabrics and integrations that connect them to virtual-infrastructure operations. The practical lesson is consistent: cross-domain visibility matters most at the moment when a symptom and its underlying dependency appear in different consoles.
Two Management Planes That Do Not Talk
Storage networks and virtual infrastructure grew up separately, and each carries its own management plane, data model, and tooling. A Fibre Channel fabric is commonly watched through metrics such as port utilization, buffer credits, frame errors, and congestion; SNIA’s description of buffer-to-buffer flow control explains how credits govern whether a sender can continue transmitting frames. Virtual infrastructure, by contrast, is watched through processor load, memory pressure, and the latency a workload experiences. Each view can be detailed inside its own domain while remaining incomplete outside it.
In a converged environment, workload performance depends directly on the storage path beneath it. SNIA notes that congestion in storage networks can produce higher latency and lower throughput, which means a storage-side condition can surface first as an application-side symptom. When the teams responsible for those layers cannot inspect the same dependency chain, diagnosis becomes a coordination problem rather than a direct technical trace.
Why Root-Cause Attribution Becomes a Guess
When storage latency spikes and a workload degrades, the operator’s question is simple: why? Without visibility across the boundary, the virtualization team can observe the effect but may not be able to distinguish a saturated fabric link, an oversubscribed port, rising frame errors, or a host-side issue. Diagnosis turns probabilistic. Teams line up timestamps across separate dashboards, trade screenshots, and reason by elimination.
Fibre Channel congestion is not an edge case: SNIA describes congestion as one of the most common problems encountered in FC SANs, including cases related to oversubscription. In regulated environments, the operational concern is broader than performance because teams also need evidence that infrastructure conditions can be traced and explained. Cross-domain observability therefore aims to move root-cause attribution from inference toward a dependency-backed explanation.
What a Unified Telemetry Model Fixes Structurally
The structural fix lives at the data layer. Storage-network telemetry must be brought into the same operational context as the workloads that depend on it, with consistent identity, health, risk, capacity, and relationship information. When a port, fabric path, or traffic flow becomes a first-class monitored entity beside the workload, an operator can follow a dependency from the slow application down to the infrastructure condition beneath it. The correlation that previously happened in an engineer’s head can instead live in the model.
OpenTelemetry’s observability primer describes observability as the ability to understand a system from its outputs and answer questions such as “Why is this happening?” The same principle applies across infrastructure domains: telemetry becomes more useful when signals can be interpreted in shared context rather than as isolated charts. For storage and virtualization, that shared context is the dependency chain.
Figure 1. A dependency chain turns a workload symptom into a traceable storage-side root cause.
Building the Adapter, Where the Hard Problems Live
Bringing those worlds together requires an analytics adapter: a translation layer that takes domain-specific storage telemetry, including Fibre Channel flow data and per-port metrics, and maps it into a generalized operational model. The translation sounds mechanical, but the quality of the integration depends on three engineering problems: data mapping fidelity, refresh latency, and schema normalization.
The first is data mapping fidelity. Storage metrics are specific and physical: buffer-credit starvation, frame-level errors, and port throughput measured against line rate. A generalized platform may reason in broader health, risk, and capacity terms. The mapping must preserve severity and meaning without either flattening an important signal or exposing raw measures that the target model cannot interpret.
The second is refresh latency. Storage problems can develop quickly, so stale telemetry weakens confidence in a supposedly unified view. The collection, transformation, and delivery path must therefore be designed for operational freshness rather than batch-style reporting. The relevant target should be defined by the decision the telemetry is expected to support, not by an arbitrary polling interval.
The third is schema normalization. Storage and virtualization domains use different identifiers, hierarchies, units, and notions of time. The adapter must normalize objects while preserving relationships such as workload to datastore, datastore to fabric path, and fabric path to port. If those relationships are lost during translation, the dependency chain breaks at the exact boundary the integration was intended to remove.
Figure 2. The analytics adapter preserves meaning, freshness, and relationships as storage telemetry enters a shared operations model.
Real-Time Flow Visibility Is the Other Half
Health scores tell an operator that something is wrong; flow visibility helps show what is moving through the fabric when the condition occurs. In shared storage infrastructure, contention can be caused by a specific traffic pattern or endpoint rather than by a uniformly unhealthy fabric. Flow-level context makes it possible to connect a high-latency workload with the path and traffic behavior beneath it.
That context is especially important in Fibre Channel, where congestion and credit behavior are closely related to how frames move between ports. SNIA’s storage-congestion guidance explains the role of credit-based flow control and the way traffic conditions affect latency and throughput. Pairing flow detail with a unified dependency model turns a broad suspicion about “the storage network” into a narrower, testable cause.
Design for the Seams
The lesson reaches beyond storage and virtualization. In converged systems, the hardest failures often live in the seams between domains that are well instrumented individually but weakly correlated with one another. The answer is not necessarily another tool inside either domain. It is a shared model that carries telemetry across the boundary with enough fidelity, freshness, and structural correctness to preserve dependencies.
When that layer is designed well, root-cause analysis becomes a walk down a dependency chain rather than a guessing game across disconnected screens. The user-visible symptom, virtual resource, datastore, fabric path, and physical port can be treated as connected parts of the same operational story. That is the practical value of cross-domain observability: making infrastructure relationships visible at the point where operators need to explain performance, risk, and impact.