

In the heat of summer, both ice cream sales and crime rates tend to rise. These two metrics are correlated – they move together – but buying an ice cream cone clearly doesn’t turn someone into a criminal. In this case, a hidden third factor (sweltering summer heat) drives both higher ice cream consumption and higher crime, creating a misleading correlation. This classic example illustrates a critical lesson for business professionals: correlation does not imply causation. In today’s data-driven business world, understanding the difference can save companies from costly mistakes.
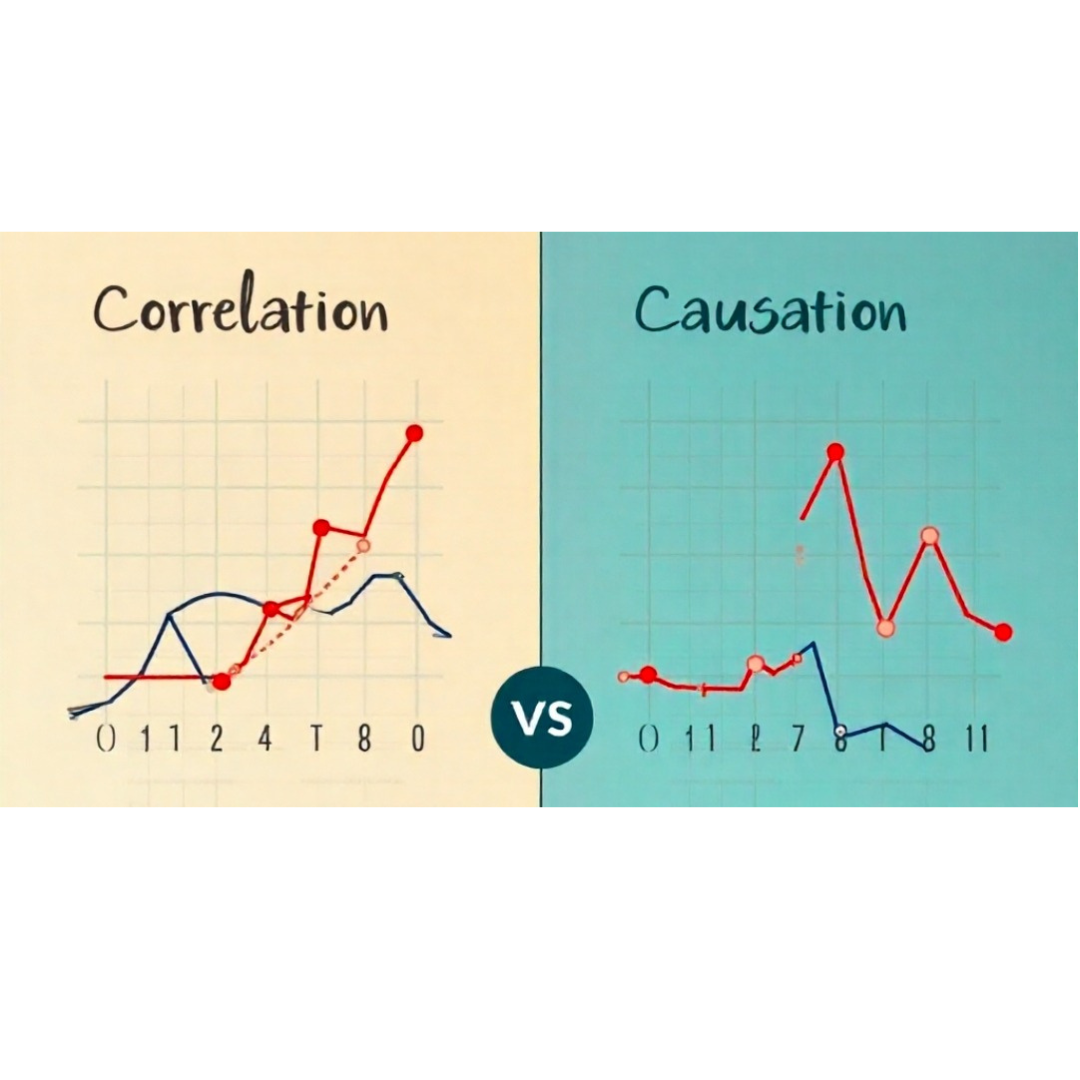
Understanding Correlation vs. Causation
Correlation means that two variables or events occur together with some regularity. If one metric rises or falls in step with another, we say they are correlated. Correlations can be positive (moving in the same direction) or negative (moving in opposite directions). For example, a company’s online ad impressions might closely track its web sales – when one goes up, so does the other. Causation, on the other hand, means one event is directly causing the other. If an increase in X actually produces an increase in Y, that’s a causal relationship. In our ad example, true causation would mean the ads themselves caused the sales to increase.
The crucial pitfall is that even a strong correlation doesn’t prove a cause-and-effect link. Two trends might move together due to coincidence or because they’re both influenced by some other underlying factor. Business analysts often repeat the mantra “Correlation is not causation” for this reason. A correlation answers, “are X and Y related?” but not “why are they related?”. Determining causation requires deeper investigation – ideally by controlling variables or running experiments to see if changing X truly changes Y. In practice, this means asking critical questions and seeking evidence beyond the raw correlation.
Correlation vs causation illustrated: Ice cream sales and crime rates may rise together during summer months, but hot weather is the real cause driving both. In business data, correlations often arise from similar lurking variables rather than true cause–and–effect links. Being aware of hidden factors is key to avoiding misinterpretation.
The Dangers of Confusing the Two
Failing to distinguish correlation from causation can lead organizations down the wrong path. Business history is rife with projects that burned money chasing illusory causes behind correlated metrics. Often a statistical analysis finds that improving Metric A accompanies a boost in Metric B – but if leaders assume A caused B without proof, they risk expensive missteps when they try to force that relationship.
A famous cautionary tale in marketing is the case of a home security company that saw sales spike whenever they ran a new ad campaign. The marketing team confidently took credit, believing the advertising caused the revenue jump. External news events (like widely reported burglaries or riots) were driving customer fear and demand, not the ads themselves. The ads correlated with sales only because they happened to run when news-driven demand was peaking – they were merely a channel for customers to respond to the existing fear. If the company had doubled its ad budget thinking it found a causal growth lever, it might have been disappointed once the news cycle calmed. As one executive put it, “correlation is not causation!” after discovering the real driver was something else entirely.
Spurious correlations can be not only misleading but sometimes comically absurd. With enough data to sift through, you can find bizarre statistical linkages that arise by pure coincidence. For instance, the per capita cheese consumption in the U.S. has correlated closely with the number of people who die tangled in their bedsheets each year. Obviously, cheese does not cause fatal bedding accidents – the synchronization of these trends is a fluke. Analysts have compiled many such tongue-in-cheek examples (like charts linking pirate populations to global warming or ice cream sales to shark attacks) to underscore how easily one can be fooled by meaningless correlations. In business contexts, the “weird correlation” might not be so obviously absurd, making it even more dangerous. It could be two sales metrics moving together for unrelated reasons, or a market trend coinciding with an internal process change. Without scrutiny, teams may chase a mirage, adjusting strategies based on a relationship that isn’t real.
Real-World Case Study: A $2 Million Onboarding Mistake
Consider the story of a SaaS startup (let’s call it Pear, Inc.) that learned about correlation vs. causation the hard way. The company noticed that new customers who completed their product onboarding process in under 15 minutes were 30% more likely to still be active users a year later. Excited by this correlation, they assumed a faster onboarding time caused the higher long-term retention. Acting on this belief, the startup poured nearly $2 million and eight months into completely overhauling their onboarding flow to make it lightning-fast.
The result? The onboarding was indeed faster – activation rates jumped by about 10% – but customer retention at 3 months didn’t budge at all. The expected payoff never materialized. What went wrong? It turns out the team had mistaken correlation for causation, and they learned an expensive lesson. Those users who onboarded quickly weren’t sticking around because of the speedy setup; rather, they were usually high-intent customers to begin with (for example, enterprise clients with dedicated implementation teams). In other words, fast onboarding was a symptom of a committed customer, not the cause of their commitment. The correlation was real, but the causation was imaginary – and roughly $2 million in engineering investment went down the drain before the company realized the truth.
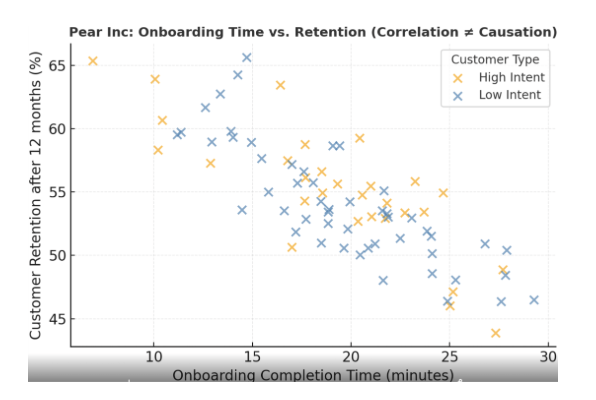
This case underscores how costly statistical misinterpretation can be. If Pear, Inc. had dug deeper, they might have discovered the third-factor effect at play – customer type and intent – before rebuilding the product. For instance, they could have segmented users by profile to see if quick onboarding predicted retention within similar customer segments. They would have found that among less committed users, speeding up onboarding didn’t turn them into loyal customers (indicating onboarding speed alone wasn’t the magic bullet). Instead, the real drivers of retention were likely factors like product need, value realization over time, and ongoing engagement – not just a fast start. This aligns with the advice that companies should err on the side of skepticism with data patterns and seek further evidence before making big bets.
Another Example: Marketing Boost or Mere Coincidence?
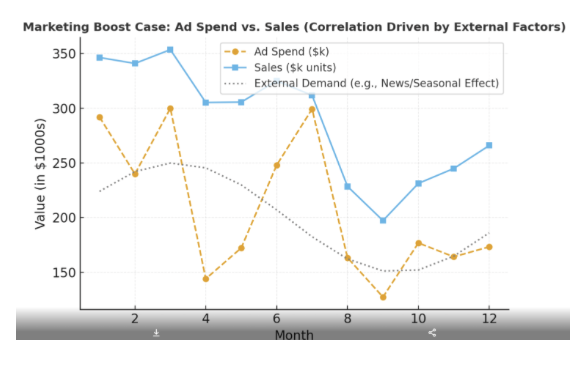
Mistaking correlation for causation isn’t limited to tech startups; it can happen in any field of business or economics. Digital marketing teams, for instance, often see a lift in sales or web traffic after launching a new campaign or website redesign. It’s tempting to declare victory and attribute the success to the marketing change. But one real-world marketing analysis revealed how deceiving this can be. A company rolled out a major website redesign and soon noticed web traffic climbed sharply. At first glance, it looked like the new design was drawing more visitors – a causal win. However, deeper analysis showed that overall demand was already rising in that period due to seasonal trends and a boost in organic search interest. The redesign happened to coincide with this upswing. In reality, the marketing team’s efforts weren’t the primary cause of the traffic increase. Had they taken the correlation at face value, they might have misallocated resources or formed the wrong strategy for future campaigns.
A similar scenario played out with a home security firm’s advertising, as mentioned earlier. Every time the company boosted ad spending, sales seemed to increase, suggesting the ads were driving revenue. In truth, outside factors like crime news drove consumers into the market, and the ads simply captured demand that was arising regardless. Recognizing such confounders is crucial. Business leaders should always ask: “What else could be causing this relationship?” If multiple things changed in the environment (economic conditions, competitor actions, news events), those need to be ruled out before credit (or blame) is given to any one factor.
How to Confirm Causation: Testing and Tools
To confidently claim causation, analysts must go beyond observing trends – they need to test them. One practical approach is to run controlled experiments. For example, if you suspect a new onboarding process causes better retention, you could do an A/B test: have a random sample of customers use the new process while others use the old, and see if retention truly differs over time. This kind of randomized experiment is the gold standard for establishing a causal effect. If only the group with the new onboarding improves, that’s strong evidence of causation. If both groups retain similarly, the “cause” was likely imagined.
When experiments aren’t feasible (like in macroeconomics or large operational changes), analysts rely on careful observational studies and domain expertise. There are some guiding questions business leaders can ask – adapted from philosopher John Stuart Mill’s criteria – to sniff out false causality:
Do X and Y consistently occur together? (If not, a one-off correlation might be a fluke.)
Does X happen before Y in time? (For X to cause Y, X must come first).
Could there be other explanations for the observed relationship? (Confounding variables or coincidence).
If an analysis can’t confidently tick all three boxes, we should hesitate to call it causation. Often, further data or research is needed. In economics, for instance, higher interest rates often correlate with lower inflation, but causality could run either direction: do rate hikes reduce inflation, or do central banks raise rates because inflation is rising? Only by studying timing and controlling other factors can economists untangle the direction of influence. The same careful thinking should be applied to business metrics.
Conclusion
It’s human nature to seek patterns and straightforward explanations – especially in the fast-paced world of business where leaders crave actionable insights. But as we’ve seen, misreading correlation for causation can lead to flawed strategies and wasted resources. The skill that separates savvy data-driven professionals is a healthy dose of skepticism and curiosity. When you spot an intriguing correlation in your sales dashboard or economic report, pause before you react. Ask “Could something else be at play?” and “How can we test this?”. Often, the real story is more complex than it first appears.
Modern businesses have more data at their fingertips than ever, but data is only as good as our interpretation. By remembering the ice cream and crime paradox and lessons from real-world case studies, professionals can avoid the trap of false causality. Instead, they can invest in finding out what truly drives outcomes – through experiments, deeper analysis, and asking the right questions. In doing so, they turn correlation into an opportunity to investigate causation, rather than a premature conclusion. In the long run, this scientific mindset leads to better decisions, smarter investments, and business strategies that actually work for the right reasons.


